
Table of Contents
Everyone claims 95%
Go and look at ten annotation vendor websites. Nine of them advertise 95% accuracy or higher. Ours does too.
Now ask any of them how they measured it.
You will get three different answers and one silence, which is the actual problem with data annotation quality metrics as they are used commercially. The number is a marketing artifact, not a measurement, unless someone tells you the reference, the sample and the method.
This is our attempt to explain what we think is worth measuring, including the parts that make our own headline number less impressive.
Why raw accuracy is a weak number
Three problems, and they compound.
Accuracy against what? If the reference is a senior annotator’s opinion, you are measuring agreement with one person, not correctness. If the reference is a consensus of three, you are measuring agreement with a committee. Neither is truth. Both are fine, as long as somebody says which one it is.
Class imbalance destroys it. A defect detection dataset that is 98% clean images can hit 98% accuracy by labelling everything clean. That model is worthless and the metric is glowing.
Some tasks have no single right answer. Sentiment, intent, harmfulness, aesthetic quality. Two careful annotators will disagree, and neither is wrong. Reporting accuracy on a subjective task without reporting agreement hides the entire question.
None of this means accuracy is useless. It means it is the first number, not the only one.
Check 1: Inter-annotator agreement
Give the same 500 items to two or more annotators independently. Measure how often they match.
This is the most informative single number in data annotation quality metrics, because it tells you something accuracy cannot: whether your task is well defined.
Low agreement has two possible causes and they need opposite fixes. Either your annotators are undertrained, in which case you run calibration. Or your task is genuinely ambiguous, in which case your guidelines are wrong and no amount of training helps.
Teams routinely misdiagnose this. They see 68% agreement, assume the annotators are the problem, and retrain. Agreement goes to 71% and stalls, because the real issue was a class boundary nobody had defined.
Check 2: Chance-corrected agreement
Raw agreement flatters you when classes are unbalanced. If 90% of your items are one class, two annotators guessing randomly still agree most of the time.
Chance-corrected metrics fix this by subtracting the agreement you would expect by luck.
Cohen’s kappa for two annotators on categorical labels. Ranges from -1 to 1. Above 0.8 is usually described as strong, 0.6 to 0.8 as substantial, below 0.4 as poor.
Fleiss’ kappa when you have more than two annotators and they are not the same pair each time.
Krippendorff’s alpha when you have missing data, variable numbers of annotators per item, or ordinal and interval labels rather than categorical ones. It is the most flexible of the three and the least commonly reported, which tells you something about how carefully most vendors measure.
A worked example. Two annotators label 1,000 images as defect or clean. They agree on 940. Raw agreement, 94%. But 88% of images are clean, so expected agreement by chance is around 79%. Kappa comes out near 0.71. Substantial, not excellent, and a very different story from 94%.
Check 3: Task-appropriate overlap metrics
Categorical agreement does not work for spatial or sequence tasks. You need the metric that matches the output shape.
| Task | Metric | Reasonable target |
|---|---|---|
| Bounding boxes | IoU (Intersection over Union) | 0.85+ for general CV, 0.90+ for precision work |
| Semantic segmentation | Mean IoU, Dice coefficient | 0.80+, higher for medical |
| Named entity recognition | Span-level F1 | 0.90+ for well-defined entities |
| Transcription | WER (Word Error Rate) | Under 5% for clean audio |
| Object tracking | MOTA, IDF1 | Task dependent, report both |
| Preference ranking | Agreement rate, Krippendorff’s alpha | 0.65+ is realistic for subjective comparisons |
That last row matters more every quarter, as annotation budget shifts toward preference and evaluation work. We covered the specifics of measuring rater quality on comparison tasks in RLHF data labeling.
Check 4: Gold standard performance
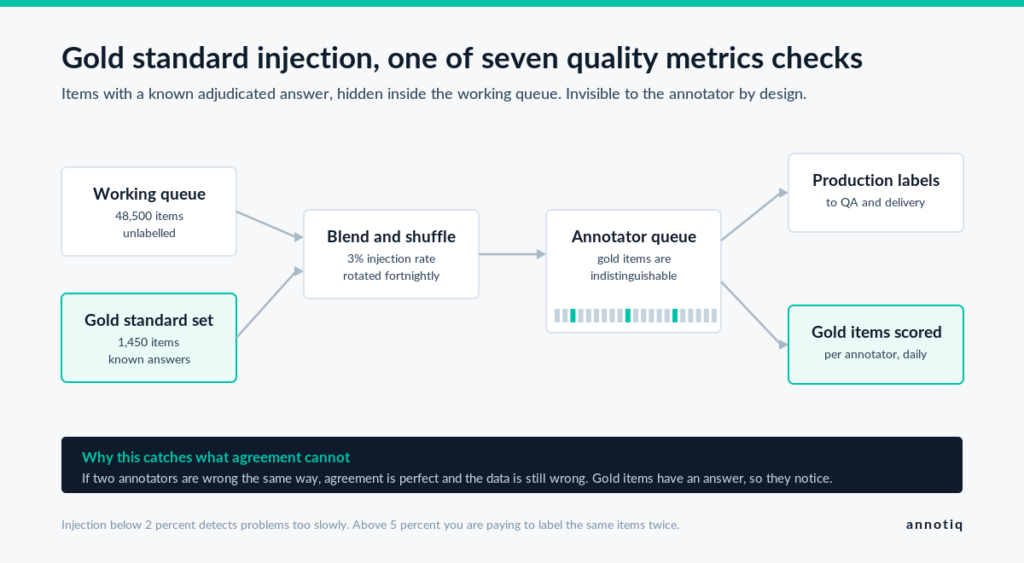
A gold standard set is a batch of items labelled to a known, adjudicated answer, injected invisibly into the working queue.
Three things make gold standards work, and most implementations get at least one wrong.
Injection rate. Somewhere between 2% and 5% of items. Below that you cannot detect a problem quickly. Above that you are paying annotators to label the same things repeatedly.
Invisibility. If annotators can spot gold items, they slow down and get careful on those specifically, and your measurement becomes fiction.
Rotation. Refresh the set regularly. Annotators memorise gold items over a long project without meaning to, and a stale set drifts from measuring quality to measuring recall.
Gold standards catch things agreement cannot. If both annotators are wrong in the same way, agreement is perfect and the data is wrong. That happens more than people expect, usually because a guideline is ambiguous in a direction everyone reads the same way.
Check 5: Per-class breakdown
A single aggregate number hides your worst problem almost by design.
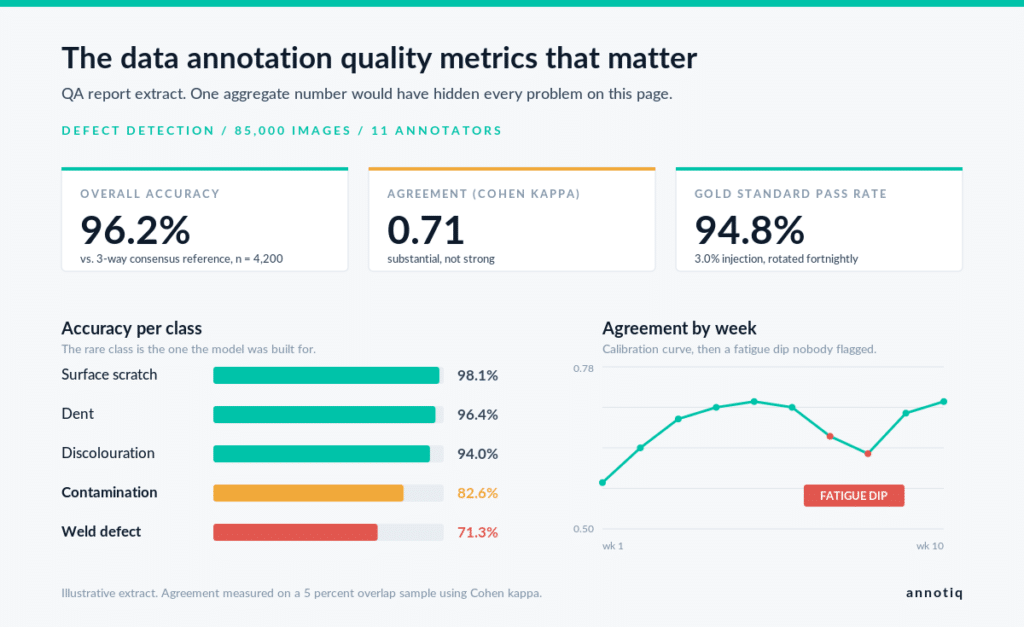
Report accuracy and agreement per class, always. Your rare classes will be worse. They are rare, so annotators see them less often and get less practice. They are also usually the classes you care about most, because rarity and importance correlate in defect detection, fraud, and medical imaging.
An overall 96% that decomposes into 98% on the majority class and 71% on the class you built the model for is not a 96% dataset.
Check 6: Annotator-level scores
Aggregate metrics average across people, which means one weak annotator gets hidden by nine strong ones.
Score individuals. Gold standard pass rate, agreement with the team, throughput, and rework rate. You will find variance, and the variance is usually not where you expect. The fastest annotator is sometimes the most accurate, because they have internalised the guidelines and stopped second-guessing.
This also matters for compliance. If you are shipping into the EU, annotator-level provenance is part of what Article 10 traceability expects, which we go through in EU AI Act training data.
Check 7: Drift over time
Quality is not a constant. It moves.
Plot your agreement scores by week. Three patterns show up repeatedly.
The learning curve, where agreement climbs through weeks one to three as the team calibrates. Expect this, and do not judge a project on week one numbers.
The fatigue dip, where scores sag in long monotonous projects, usually around week six to eight. Rotation and task variety help more than lecturing.
The guideline shock, where a mid-project clarification splits your dataset into before and after. Sometimes the after is better and the before needs re-labelling. You only know if you were watching.
How much label noise can a model take?
More than most people fear, with one large caveat.
Models tolerate random noise reasonably well. A few percent of labels wrong in unpredictable directions mostly washes out, especially with a large dataset, because the errors do not point anywhere consistent.
Systematic noise is a different animal. If your annotators consistently mislabel a specific edge case, the model learns that mistake as a rule. A 1% systematic error can do more damage than 5% random, and it will not show up in your aggregate metrics at all. It will show up in production, on exactly the cases you cared about.
Which is the real argument for per-class reporting and gold standards. Aggregate numbers detect random noise. Only the granular ones detect systematic noise.
The QA report your vendor should be handing you
Every delivery should come with a document containing all of the following. If yours does not, ask why.
Metric definitions, including what the reference standard was. Sample size for every reported figure. Overall accuracy and agreement. Per-class accuracy and agreement. Gold standard results with injection rate stated. Annotator count and individual score distribution. Adjudication process for disagreements, and how many items went through it. Known limitations, written honestly.
That last one is the tell. A QA report with no limitations section was written to reassure you rather than inform you.
This report is also the artifact that makes the rest of your compliance and vendor management work. It is the evidence behind an Article 10 file, and it is the thing that makes a vendor comparison meaningful rather than a race between marketing claims. If you are running that comparison now, the scorecard in outsourced data annotation vs in-house has the questions to ask.
What is a good inter-annotator agreement score?
It depends on task subjectivity. For clear categorical tasks, Cohen’s kappa above 0.8 is strong. For inherently subjective tasks like sentiment or harmfulness, 0.6 to 0.7 may be the realistic ceiling, and a vendor claiming 0.95 on a subjective task is measuring something other than what they say.
What is the difference between Cohen’s kappa and Krippendorff’s alpha?
Cohen’s kappa handles two annotators on categorical labels. Krippendorff’s alpha handles any number of annotators, missing data, and ordinal or interval labels. Alpha is more flexible and less commonly reported.
How many gold standard items should I inject?
Between 2% and 5% of the working queue. Rotate the set periodically so annotators do not memorise it.
Can a dataset have high accuracy and still be bad?
Yes. Class imbalance can produce high aggregate accuracy on a dataset that is systematically wrong about the classes you care about. Always report per class.
What data annotation quality metrics matter most for computer vision?
IoU for spatial correctness, per-class accuracy for coverage, and gold standard pass rate for consistency. Report all three, not one.
How much label noise will break my model?
Random noise in the low single digits is usually survivable. Systematic noise at the same rate is not, because the model learns the error as a pattern.
How we measure it
Every Annotiq project ships with the QA report described above. If you want to see a sample before committing to anything, book a free demo and ask for one.